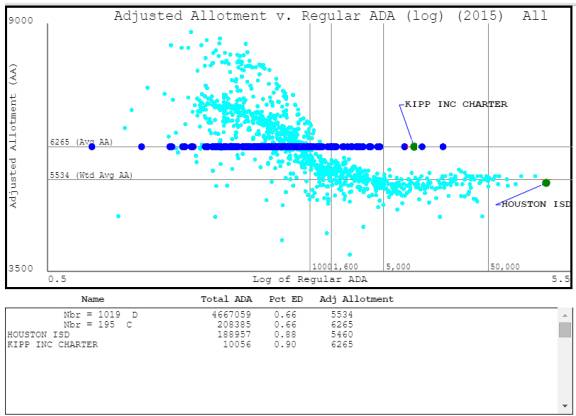
The following graph is used in several of the papers linked to on this web page. It is extremely helpful in understanding why charter schools, on average, receive greater amounts of maintenance and operations (M&O) dollars than do regular school districts. The graph shows the adjusted allotments (AAs) for all school district in color aqua. The arithmetic average of those AAs is $6,265 (for school year 2014-2015). This value is plotted for each charter school with color blue. As can be seen, $6,265 exceeds the AA for virtually all ISDs with regular ADAs exceeding 1,000. Only 4 percent of ISD ADA is included in the 400+ small districts that pull this average up. Approximately 70 percent of charter school students are in charter schools where their AAs exceed that for similar-sized ISDs. This is why, on average, charters receive more M&O dollars per pupil than do ISDs. The AA is perhaps the most crucial factor in Texas’ school funding formula.
This graph can be accessed at www.polinetworks.com/aa where it is available in an interactive form. It is possible there to identify the individual districts, to display them by senatorial district, and perform several other functions. Instructions for using these features are available here. The cover page for the instructions include links to two pages where 2014 reading and math scores for charters and ISDs are also displayed in interactive diagrams.