Presentation and extension of Legislative Budget Board’s projections for current law and House Bill 21
School Year 2017-2018
Larry Toenjes*
The Texas
Legislative Budget Board (LBB) recently created printouts comparing their
projections of maintenance and operations revenues to be received by Texas
school districts and charter schools during the next biennium. Those projections for the first year of the
biennium—2017-2018—were extracted from LBB’s document and were used to create a
number of exhibits that follow.[i] Several additional data elements were merged
with the projections by LBB that were used in some other exhibits below.
The purpose of
creating these exhibits was to demonstrate how some fairly simple graphics can
be used to provide an overview of the results of such projections, as well as
to provide a level of detail that is difficult to convey from the standard
district-by-district printout.
The following
heading and leading paragraph was taken from the LBB-prepared printout
document. Model 060 refers to projections based on current law; Model 26690
refers to projections using changes to current law embodied in HB 21, authored
by Rep. Huberty, chairman of the House Education Committee.
“Total Maintenance &
Operations (M&O) Revenue Comparison for School Districts between Current
Law (Model 060) and Model 26690
FISCAL YEAR 2018
Note: All figures below are estimates and are
subject to change based on actual and final student counts, property values,
and tax effort. Current law amounts reflect
LBB Model 060, which is based on available statewide estimates and may differ
from local projections. Updates to key source data including student counts,
property values, and tax rates may change results significantly. The amounts below do not include
distribution of the $100,000,000 provided under this scenario for the Hardship
Aid Grant Program because grant amounts and recipients are not known at this
time.”
The following are the column headings that LBB provided on each page of their printout.
1.
District Name 6.
Change in Total M&O Revenue
2.
County District Number 7.
Current Law (M&O revenues per WADA)
3.
Current Law (CL) WADA 8.
Model 26690 (M&O revenues per WADA
4.
Current Law Total M&O Revenue 9.
Change in Total M&O Revenue per CL WADA
5.
Model 26690 Total M&O Revenue
Some of the additional variables that were added to these data, taken from files obtained from the Texas Education Agency and which pertained to their Summary of Finances reports for the current school year (2016-2017) included the following:
Refined ADA
WADA
Property wealth per WADA
Percentage of economically disadvantaged students
Maintenance and operations tax rates
Property valuations by six property type categories
Geographical coordinates
Since it has been well established that per pupil revenue comparisons between charter schools and independent school districts (ISDs) should not be based upon the use of WADA, it was desired to construct projections of M&O revenues per ADA based on LBB projections.2 While LBB did provide projections of total M&O revenues, projected ADA numbers for the next biennium were not included. They did provide projections of revenues per WADA. These could be converted to revenue per ADA by (a) multiplying by WADA and then (b) dividing that product by ADA. This would be the same as multiplying the projected revenues per WADA by the ratio WADA/ADA. As both of these numbers were available for the current school year, their ratio for SY 2016-2017 was used to multiply LBB’s projections of revenues per WADA to convert them to revenues per ADA. While not exact, the factors that create WADA as a multiple of ADA are considered to be sufficiently stable from year to year to make this technique meaningful. Consequently some of the exhibits below use these estimates of M&O revenues per ADA for SY 2017-2018.
Similarly, property wealth per WADA numbers that are used in some of the exhibits below were those that had been established for the current school year as well. While these values would obviously vary somewhat from year to year, it is not felt that the differences in those values for the next school year would be sufficient to materially alter the overall patterns that result when they are used on the horizontal axis of several of the exhibits.
Exhibit 1. LBB projections of M&O revenues per WADA under current law
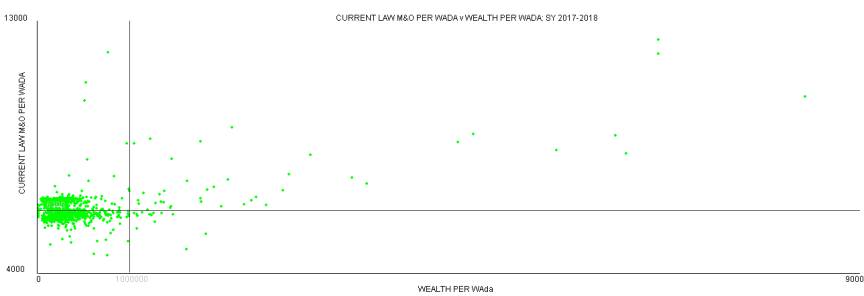
Note that the horizontal axis extends out to $9 million per WADA. A vertical line is located where the property wealth per WADA is $1 million. The extreme scales were chosen so that all school districts would be displayed. Charter schools are not shown, as they would all fall on the vertical axis since they have no property tax base.
Less than one percent of ADA is contained in the 54 districts with property wealth per WADA greater than $1 million. Further, only approximately 0.7 percent of ADA is contained in the 35 districts with projected revenue per WADA greater $7 thousand per WADA.
It is clear in the above diagram that for districts with
property wealth per WADA greater than $1 million, there remains a strong,
positive relationship between property wealth per pupil and revenues per
pupil. But as pointed out, these
districts contain only about 0.7 percent of all ISD students. In addition, the observed positive relationship
would be more pronounced if not for the recapture provisions of the current
formula.
Exhibit 2. LBB projections of M&O
revenue per WADA under HB 21
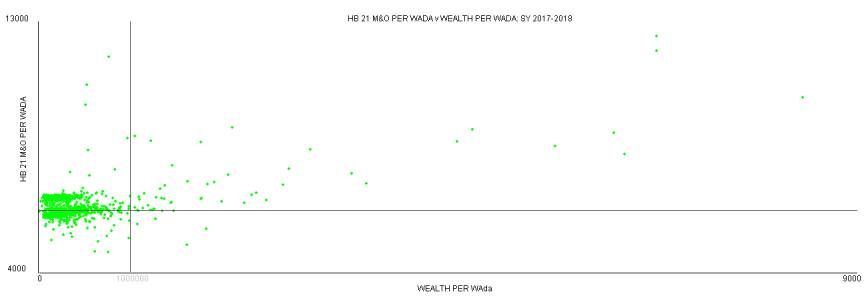
This diagram looks about the same as the previous one. Only by putting the two together and drawing
green lines if a district’s revenue increased, or red lines if it decreased,
can the differences in the two be detected (See Exhibit 3).
Exhibit 3. Gainers and losers, current
law compared with HB 21, SY 2017-2018
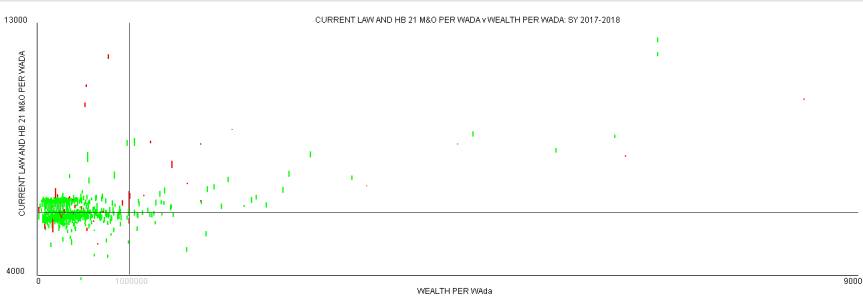
The length of each line in this graph indicates the gain (green) or loss (red) for each district in terms of M&O revenues per WADA, in going from current law to HB 21 for school year 2017-2018.
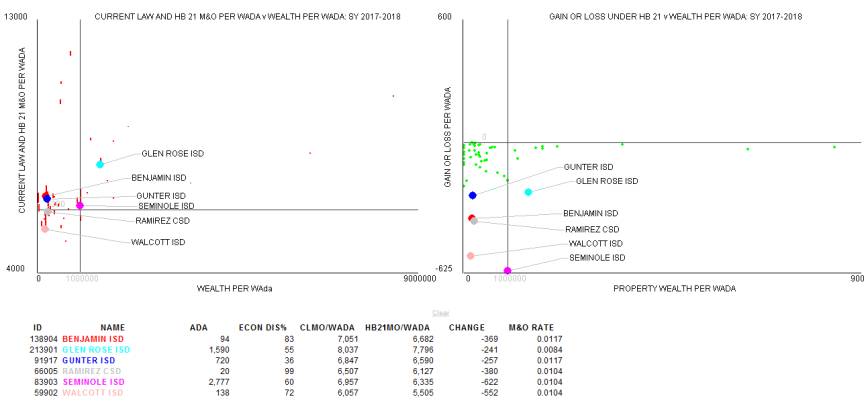
Exhibit 4. Districts receiving less M&O revenue per WADA under HB 21, SY 2017-2018
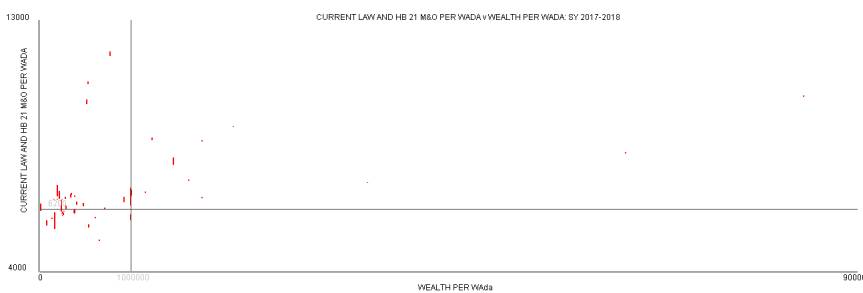
Retaining only those districts that do less well under HB 21 than under current law, the 55 losers are displayed with red lines indicating the amount of their decline. About half of these end up with M&O revenues per WADA below the statewide average of $6,200.
Exhibit 5. Makeup of property tax base for several of the districts that are projected to lose M&O revenue per WADA under HB 21.
The five districts highlighted in this graph are mostly quite small, have relatively low M&O tax rates, and small proportions of single-family residential property making up their tax bases.
The horizontal line shown at a y-value of $6,200 represents the WADA-weighted average M&O revenue per WADA for all districts. As can be seen, some of the districts that lose under HB 21 are well above this average, some are below.
To the extent that the districts that are wealthier, from the property value per WADA perspective, must make recapture payments to the state, the vast bulk of those payments do not come from taxes on single family residences.
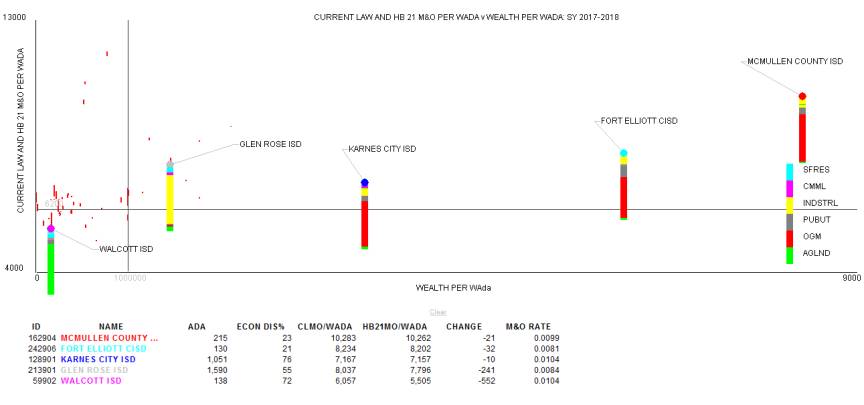
Exhibit 6. Six of the largest losers under HB 21
The diagram on the right above plots, on the vertical axis, the dollar amounts of the reduction in M&O revenues per WADA for those districts that get less under HB 21. The six districts losing the most are highlighted. Four of these six districts have projected revenues under HB 21 that remain above the average for all districts (see graph on left). Ramirez ISD is projected to end up slightly below the current law average; Walcott ISD nearly $700 per WADA below that average. Ramirez ISD also has the highest percentage of economically disadvantaged students among these six. These are also two of smallest districts of the six, and as a result their M&O revenues per ADA would be expected to be much higher.
Exhibit 7. Effects of different tax rates upon M&O revenue levels
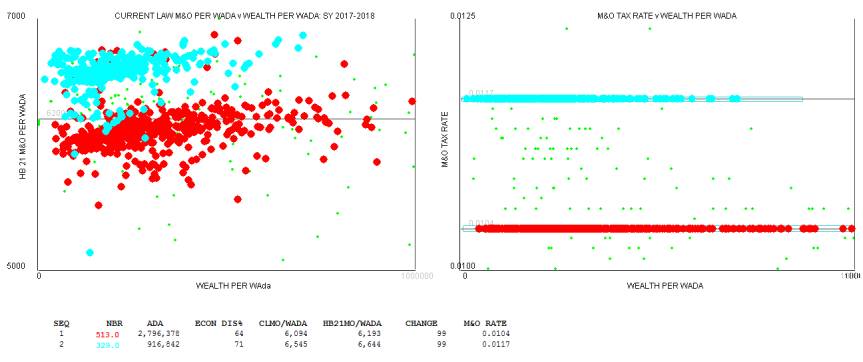
The districts highlighted in cyan have M&O tax rates of 1.17 (per hundred dollars of taxable value), or 0.0117 in absolute terms. Those highlighted in red have tax rates of 1.04. The M&O per WADA for these two groups, under HB 21, differ by $451. The districts at the 1.17 tax rate also have 7 percentage points more economically disadvantaged students, but since the revenues are expressed using WADA this difference would be largely unseen.
Exhibit 8. Current law M&O revenues per ADA, SY 2017-2018
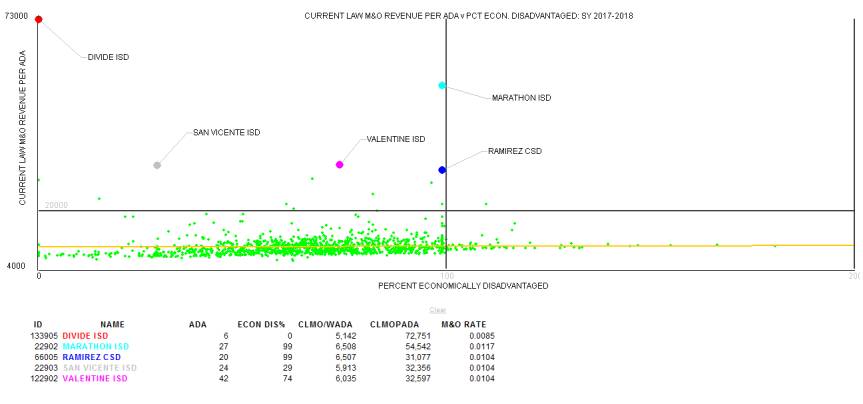
The vertical and horizontal scales in this diagram were selected so that all districts and charter schools could be included. The vertical scale represents M&O revenues per ADA. The revenues per WADA projected by LBB were converted to an ADA basis as described previously. The five districts with the greatest values of revenues per ADA are highlighted. These are very small districts that receive very large adjustments for size and sparcity.
Current law projected M&O revenues per ADA are designated by “CLMOPADA” in the table portion of the above diagram.
Exhibit 9. 216 highest revenue districts contain just 1.1 percent of statewide ADA
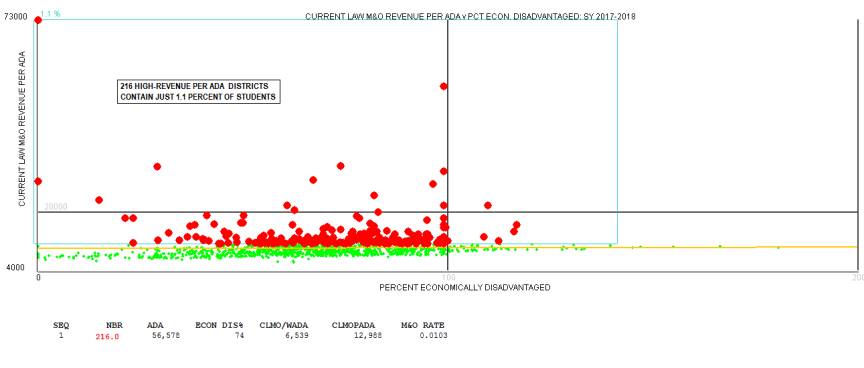
The horizontal axis in this diagram represents the percentage of economically disadvantaged students in each district or charter school. The 216 districts with highest levels of M&O revenues per ADA are highlighted in red. They contain only 56,578 students (ADA), or about 1.1 percent of all students in ISDs.
As can be seen, there are many districts or charter schools with percentages of economically disadvantaged students that exceed 100 percent. There are 47 charter schools whose percentages of such students exceed 100 percent, but only 14 ISDs. The most extreme case is Houston Heights LEA with 181 percent economically disadvantaged students, with only 62 students in ADA.
Exhibit 10. Charter schools (blue) and ISDs (red) with ADAs greater than 1,600
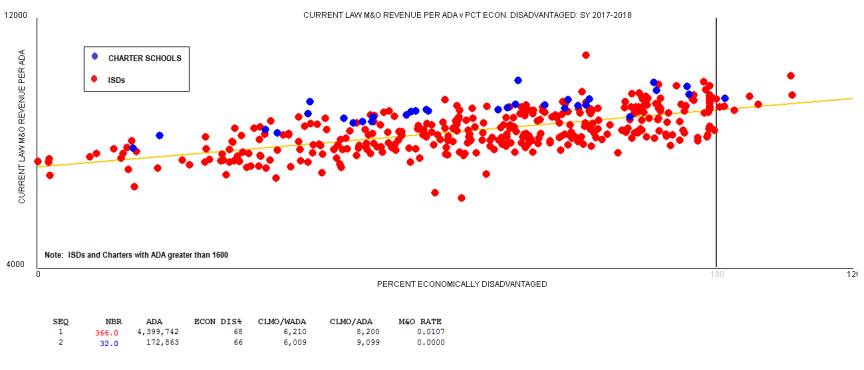
Charter schools receive greater amounts of M&O revenues per ADA than do ISDs. This is especially true in most cases for charters and ISDs with ADAs greater than 1600. The above diagram shows clearly that both charters and ISDs tend to receive greater amounts of M&O revenues per ADA with higher percentages of economically disadvantaged students. ISDs tend to receive more revenues if they tax themselves at higher tax rates. For the charters and districts in this category, charters receive, on average, $899 more in M&O revenues per ADA than do ISDs. This is primarily due to the higher adjusted allotments assigned to charters. The statewide average of adjusted allotments of ISDs, which is used for all charters, is biased upwards because of the impact of the small district adjustment on the adjusted allotments of the smallest 450 or so districts that benefit from the small district adjustment. These 450 small districts contain only about 4 percent of all ISD students, yet each one counts equally to the largest ISDs in calculating this average.
Exhibit 11. Effect of different M&O tax rates upon M&O revenues for ISDs with ADA greater than 1,600
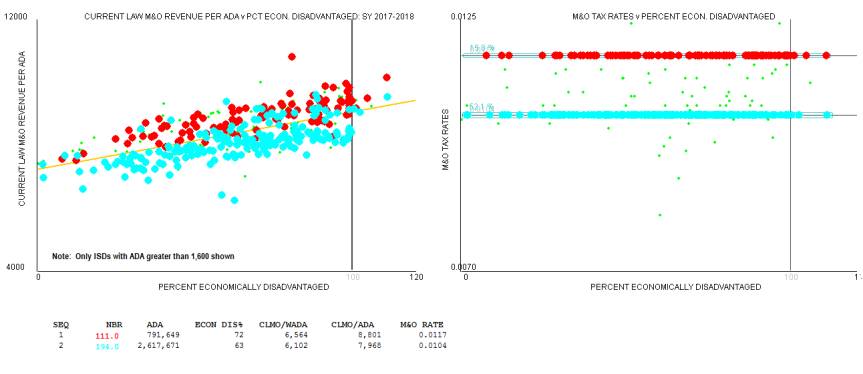
The diagram on the left plots ISDs’ M&O revenues per ADA against their percentages of economically disadvantaged students. The diagram shows ISDs’ M&O tax rates on the vertical axis. Tax rates tend to cluster at two levels—1.04, the highest rate that can be used without a referendum, and 1.17, the highest rate allowed under the law ( with two exceptions, districts in Harris County that were grand fathered in to previously held higher rates). The average difference in M&O revenues per ADA between these two groups of ISDs is $833. Note that approximately half of all Texas students are in ISDs with the 1.04 rate, and several ISDs have even lower tax rates.
These two groups of districts were highlighted by drawing a
rectangle around the districts that were plotted at these tax rate levels in
the right-hand graph.
Exhibit 12. Charter schools (blue) and
ISDs (red) located in Harris County
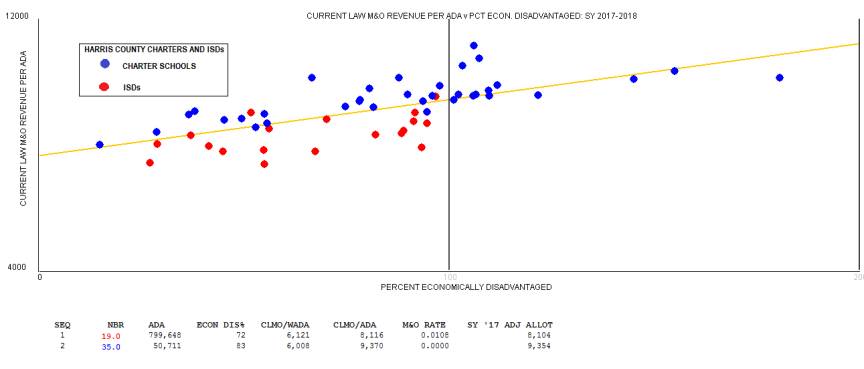
The M&O advantage in charter schools is even more pronounced when compared with ISDs in Harris County only, where charters enjoy a $1,254 average advantage of M&O revenues per ADA. Part of this difference may be attributed to the fact that more ISDs in Harris County are at the 1.04 M&O tax rate or lower as opposed to being at the 1.17 rate or higher. However, 14 charter schools have percentages of economically disadvantaged students in excess of 100 percent, which results in more state dollars being directed to them. Part of the explanation of these high rates may be explained by charters that have large numbers of pre-K students which count for just a half-day for ADA purposes, but may count as full-day for purposes of the free or reduced-price lunch program. The existence of such large free-lunch counts may also explain much of the difference in the percentages of economically disadvantaged students between ISDs (72%) and charters (83%) in Harris County.
Exhibit 13. Charter schools and ISDs in Harris County, selected pairs highlighted
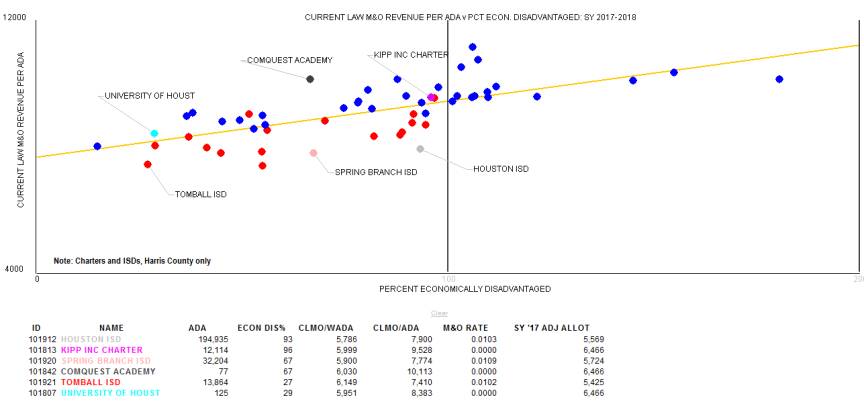
This diagram again shows charter schools and ISDs in Harris County, plotted with LBB’s projections of M&O revenues for SY 2017-2018 under current law, with the amounts adjusted to an ADA basis as described above. The amount of the adjusted allotment for the current school year was added to the table beneath the diagram. Three charter-ISD pairs were high-lighted, with the percentages of economically disadvantaged students in each pair approximately the same.
For example, the data indicated that KIPP Inc received some $1,628 more in M&O revenues per pupil than did Houston ISD. The data in the last column to the right also indicate that for the current year the adjusted allotment for KIPP Inc exceeded that for Houston by $897. In this case, with both of these entities having more than 5,000 students in regular ADA, and drawing students from approximately the same geographical area, and having approximately the same percentages of economically disadvantaged students, there is no cost-based reason for such a large difference in adjusted allotments. Not only is KIPP Inc’s adjusted allotment used to multiply the numbers of students in its regular students program, and its extra-cost programs such as special education, but these inflated allotments result in an inflated value of KIPP’s WADA, which in turn drives funding in the enrichment tiers.
Exhibit 14. Current law projections for SY 2017-2018, M&O per ADA, charters and districts greater than 1000 in ADA
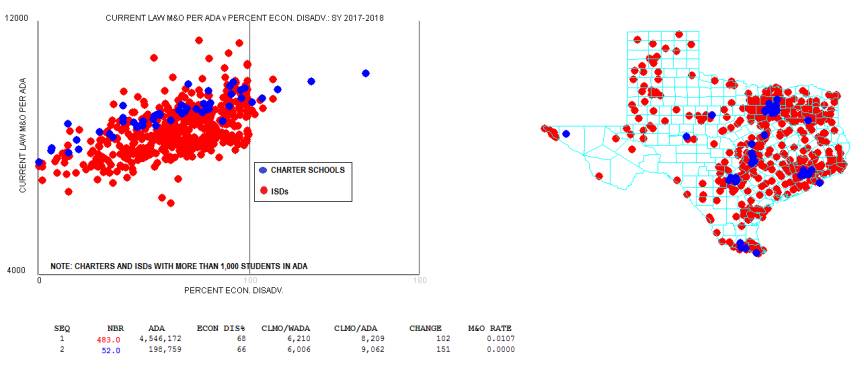
Only districts and charters with more than 1,000 students in ADA are included in the diagrams and data shown in Exhibit 14. The 483 ISDs (red) included contain approximately 95 percent of all ISDs’ ADAs, while the 52 charter schools (blue) shown contain approximately 79 percent of all charter schools’ ADAs.
The M&O per student averages are shown in two forms: (a) on a WADA basis –CLM0/WADA—and (b) on an ADA basis—CLM0/ADA. As can be seen from the figures beneath each of these headings when WADA is used as the divisor it appears that ISDs receive $204 more per pupil than the charters, whereas when ADA is used as the divisor charters on average receive $853 more per pupil than ISDs. Given that ISDs actually have a larger percentage of economically disadvantaged students in this comparison, this demonstrates that comparisons of revenue per pupil between charter schools and ISDs should not be performed using weighted students (WADA) as the divisor.3 This is because the same features of the funding formula that cause extra M&O funds to be allocated to charter schools also causes charter schools’ WADA numbers to be inflated by the same proportion, making any comparisons to ISDs based on M&O revenues per WADA misleading.
One other interesting aspect of this exhibit is the geographical concentration of charter schools, clearly visible in the map of Texas.