Texas Charter Schools: The large ones get too much, the small ones too little
Laurence A. Toenjes*
Texas Charter school proponents, especially the Texas Charter School Association and the executive director of KIPP Inc., Houston, publicly maintain that there is a $1,000 funding “gap” between Texas’ open enrollment charter schools (Charters) and Texas’ traditional public school districts (TPSDs).[1] Most of this alleged shortfall is an illusion.
In Texas, TPSDs and Charters vary widely in enrollments, percentage of economically disadvantaged students and other characteristics. Some of these differences result in the generation of additional state financial aid. It has been customary, when comparing revenues between different TPSDs, to divide revenues to each district by a weighted student count. The weighted student count, referred to as WADA in Texas, is intended to make comparisons between districts that have different proportions of more costly to education students more equitable. Other things being equal, districts with greater proportions of more costly students would receive higher WADAs. This would cause reductions in such districts’ revenue per WADA, relative to districst that had fewer such extra cost students. This avoids the situation where it appears that one district is unfairly receiving more revenue than another only because it serves more students with extra costs associated with them. It is intended to permit apples to apples comparisons.
Unfortunately, there is a problem in how WADA[2] is calculated for Charters in Texas, which makes comparisons of revenue per WADA between Charters and TPSDs invalid[3]. This problem is so severe that WADA should not be used as the divisor of revenue amounts when comparisons between Charters and TPSDs are made. WADA does not represent the same thing for Charters as it does for TPSDs. Therefore comparisons between the two, based on comparisons of revenues per WADA, are invalid. Dividing total Charters’ revenue by total WADA severely understates that ratio in comparison with total revenue per total WADA for TPSDs.
The problem of determining WADA for Charters is a direct consequence of how several statewide average parameters that are applied by the Texas Education Agency (TEA) in calculating state aid to Charters are determined. In addition to causing an understatement of Charters’ revenues, when expressed on a per WADA student basis, the entire process of funding Charters’ in Texas tends to give too little to the smaller Charters while giving too much to the larger ones. This was even pointed out by expert witnesses hired by the Texas Charter School Association (TCSA).[4]
In their brief filed with the Texas Supreme Court on April 14, 2015, in which they appeal the ruling of Judge Dietz in the 200th Judicial District Court, Travis County, Texas, the TCSA, through their attorneys, expressed concern primarily about the alleged $1,000 funding gap. But their brief also complains that not all Charters are being equitably funded.
“Charter schools receive funding based on state-wide averages. School district funding, on the other hand, is adjusted to account for a district’s size, sparsity and cost of education.”[5]
The same complaint is repeated in Appendix 5 of their brief:
“Each charter school receives the same Adjusted Allotment—the Statewide Average of the Adjusted Allotments for each ISD, regardless of its size, sparsity or cost of education.”[6]
At least five factors are applied to the determination of Charters’ state aid that are based on the averages of the values of the corresponding concepts that are calculated individually for each TPSD. The most important of these is the Adjusted Allotment (AA), the focus of the TCSA’s complaint quoted previously.
This is a legitimate issue. The Adjusted Allotments are calculated for each of the individual TPSDs. They in fact reflect the values of district size, sparsity, and cost of education. The average[7] of these is then used in funding Charters, with the same average amount applied to all of them, as claimed.
The portion of the law, which guides the TEA in this process, is contained in Title 2 Subtitle C Chapter 12 Section 12.106(a-1)[8]. It reads as follows:
“In determining funding for an open-enrollment charter school under Subsection (a), adjustments under Sections 42.102, 42.103 ,42.104, and 42.105 are based on the average adjustment for the state.”
Turning to Section 42, Section 42.102[9] deals only with the cost of education adjustment. The manner in which this adjustment to the basic allotment is determined for TPSDs does not depend on size or sparsity. It would therefore be reasonable to assume that the result of averaging the cost of education adjustment factors for all TPSDs would be applied to all Charters, regardless of size or sparsity.
Section 42.103 deals with small and mid-size district adjustments. It prescribes how each TPSD’s size and sparsity measures are to be used in further adjusting the basic allotment that was modified by the cost of education in Section 42.102. In this section the resulting adjustment of the basic allotment determined under the previous section, Section 41.102, is defined as the “ABA”, for the adjusted basic allotment. This section, Section 42.103, then describes how the ABA should be further adjusted, which transforms it into the “adjusted allotment per student”, which is designated as “AA”.
This is where it gets interesting. Recall that the language in Chapter 12 Section 12.106(a-1) states that “…adjustments under Sections 42.102, 42.103, 42,104, and 42.105 are based on the average adjustment for the state.”
The Charters complain that the single statewide average applied to them does not reflect their individual values of “size, sparsity or cost of education.”[10]
The question is whether “the average adjustment for the state” applies to each of these sections in turn, or only applies to the end result for them all.
The instructions in Section 42.103 apply three different formulas for transforming the ABA into the AA for TPSDs, depending upon whether a district (a) has less than or equal to 1600 students in regular ADA and also has a geographic area of less than 300 square miles; (b) has less than or equal to 1600 students in regular ADA and has a geographic area of 300 square miles or more; or (c) has less than 5,000 students in regular ADA and offers all grade levels from kindergarten through grade 12.[11]
If the “average adjustment for the state” applied only to the final result then the reference to the various sections individually would not be necessary.
The criteria in conditions (a) – (c) divide TPSDs into three groups. A fourth and very important group consists of those with regular ADAs greater than 5,000 students.
Charters do not have clearly defined boundaries. It is therefore not possible to apply the same measure of sparsity to Charters as to TPSDs. Consequently, in what follows only the small district adjustment formula for TPSDs with areas less than 300 square miles will be used in determining groupings for Charters and for performing separate averages of adjusted allotments (AAs) for TPSDs. This eliminates group (b) above.
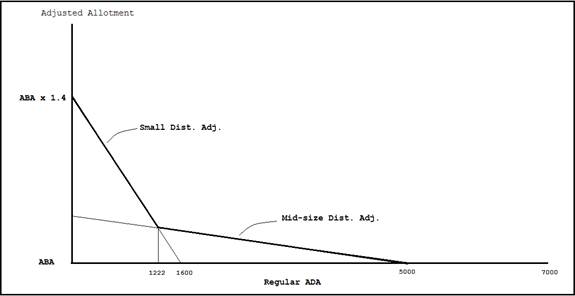
After the adjustments under each of the formulas for which a TPSD meets the criteria are calculated, the adjustment giving the largest AA is then applied. The reason a “choice” is offered is because a TPSD with, say 1590 students would receive a larger adjustment under the formula that applies to any district with fewer than 5000 students in regular ADA than under one of those that applies only to districts with less than 1600 students in regular ADA. However, the transition point can be mathematically calculated. Figure 1 demonstrates the cutoff point where the small district adjustment formula (for districts with area less than 300 square miles) intersects the mid-size district adjustment formula.
Since districts receive the greater benefit of being adjusted with either of these, districts with a regular ADA of less than 1600 but greater than 1222 would have their adjusted allotment determined with the mid-size district adjustment formula, as shown.
The major point is that statewide average adjustments to TPSDs within the three different regions determined by size can unambiguously be calculated by determining in advance which region a district should be placed in for maximum benefit. The averages within each region can then be applied to all of the Charters that fall within each region, based on their numbers of regular ADA students.
Figure 1
The Small and Mid-size District Adjustment Formulas and the Regular ADA Value at Their Point of Intersection
One point that is not at all ambiguous in applying Section 42.103 is whether a TPSD is eligible for the adjustment under this section. If the TPSD has 5000 or more students in regular ADA it does not qualify for an adjustment under Section 42.103. Inasmuch as Chapter 12 Section 12.106(a-1) makes specific reference to Section 42.103, and this section is applied to TPSDs based on their size and sparsity, it would seem
logical that the averages for each subgroup of TPSDs would be applied to Charters depending on which of the groups they fall into.
The legal issue is whether Chapter 12 Section 12.106(a-1), should be applied separately to the subgroups to which Section 42.103 applies in the case of TPSDs, or whether the manner in which it has been applied by TEA, which does not recognize the distinction among the subgroups of TPSDs as well as Charters, is correct.
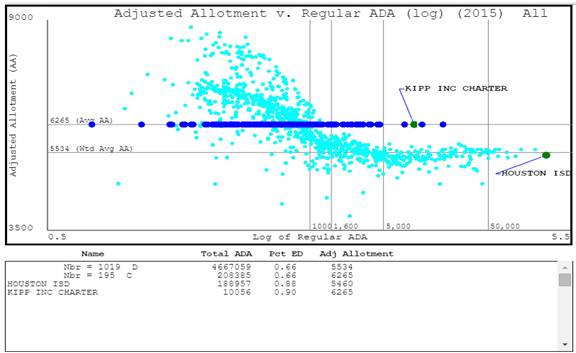
The practical issue is best described with the aid of Figures 2 and 3. Both figures show the values of the adjusted allotments for TPSDs and for Charters for school year 2014-2015. The values for the AAs are plotted on the vertical axis. The values for their numbers of students in regular ADA are plotted on the horizontal axis. Actually, the values plotted on the horizontal axis are the logarithms of regular ADA amounts. Not using the logarithms would result in a diagram where the hundreds of very small districts would be indistinguishably bunched up at the left hand end if the scale were made large enough to include the very largest school district, Houston ISD, at the right. Note that certain values are identified in normal terms: 1000, 1600, 5000, and 50,000 for reference.
In Figure 2 the AAs for all charters fall on the line representing a value of $6,265. This was the statewide average adjusted allotment for all TPSDs for that year that was applied by TEA to all Charters. If the TCSA’s complaint (above) was honored, and size was taken into account, Charters with regular ADAs in excess of 5,000 would not receive any benefit from adjustments made under Section 42.103. Instead of having AA values of $6,265 they would fall somewhat lower, say at the level where Houston ISD is located. To draw this contrast, Houston ISD and KIPP Inc Houston are identified in Figure 2. KIPP Inc had an AA of $6,265, whereas Houston ISD’s was just $5,460, $805 less. This makes a difference of at least $17,710 for every classroom of 22 students.[12] Note that both had regular ADAs exceeding 5000 so neither would be eligible for an adjustment under Section 42.103. Consequently, there is no reason why KIPP Inc’s AA should be greater than that for Houston ISD.
Figure 2
It was attempted to determine how Charters would be affected if the average AAs were calculated separately for each of the size categories. The average adjusted allotments were determined separately for small TPSDs, for mid-zed TPSDs, and for those with regular ADAs exceeding 5,000 students. The resulting three average adjusted allotments are shown in Table 1[13].
Table 1
Numbers of Districts and Charters in Small, Medium and Large Categories
Total ADA and Average Adjusted Allotments
|
|
Traditional School Districts |
Charters |
|||
|
Size Category (regular ADA) |
Nbr of Districts |
Total ADA |
Average AA |
Nbr of Charters |
Total ADA |
|
0 to 1222 |
614 |
311,653 |
6712 |
159 |
73,420 |
|
1222 to 5000 |
249 |
676,499 |
5587 |
31 |
77,805 |
|
Greater than 5000 |
156 |
3,678,908 |
5417 |
5 |
57,161 |
|
Totals |
1019 |
4,667,060 |
6263[14] |
195 |
208,385 |
Data source: Basic data for each TPSD obtained from the Texas Education Agency.
Calculations of adjusted allotments (AA) made by the author.
The different values for the adjusted allotments (AA) are represented by the three horizontal red lines in Figure 3, each of which extends over the relevant range of regular ADA.
It is argued, based on Figure 3, that there is more coherence between the values of the adjusted allotments for Charters, indicated by the relationship between the red lines and the actual values of AAs assigned to TPSDs. For example, currently, all mid-size and large Charters are assigned values for their adjusted allotments that exceed those actually calculated for all TPSDs with regular ADAs greater than 1600 students. If the alternative AAs were used instead—$5587 for the mid-sized Charters and $5417 for those greater than 5000 in regular ADA students—there would be some TPSDs above and some below those values in both of these size ranges, as can be observed in Figure 3. That would seem to correspond more closely to how the use of “average” values would normally operate—some would be above, some below.
The only reason why the AAs of all mid-sized and large Charters presently exceed the AAs of all TPSDs in these size ranges is because the current method of determining the statewide average of the adjusted allotments assigned to Charters permits the very large benefits of the small district adjustment to influence the AAs that are assigned to Charters in the larger size categories. This seems to violate the provision of Section 42.103 that explicitly restricts the influence of the scale adjustments for TPSDs with regular ADAs of less than 5000 students from influencing the adjusted allotments of TPSDs which are greater than that. Similarly, the effect of the scale adjustments for TPSDs that have regular ADAs of less than 1222 students are not permitted to influence the adjusted
Figure 3
Districts and Charters shown at levels of the adjusted allotments for school year 2014-2015 with alternative values of Charters’ adjusted allotments shown as red lines
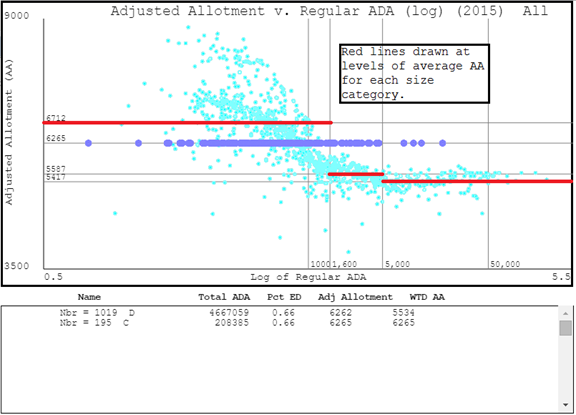
allotments of TPSDs which are larger. It seems logical that in applying Chapter 12 Section 12.106(a-1), which explicitly references Section 42.103, that these same conditions should be applied. Doing so would alleviate the problems described in Toenjes (2015) (see footnote 2). In addition, the changes suggested here would at least partially address the complaints of the Charter school proponents quoted above, since the effect of Charter size upon adjusted allotments would be determined separately for small, medium and large size Charters. The small Charters would receive more state aid, the larger ones less.
Conclusion
Under current law and practice, small Texas open-enrollment
charter schools receive too little state aid, while the larger ones receive too
much. This condition is at least in part a result of the manner in which the
school code—Chapter 12 Section 12.106(a-1)-- is currently being
interpreted. This interpretation should
be reexamined.
Endnotes